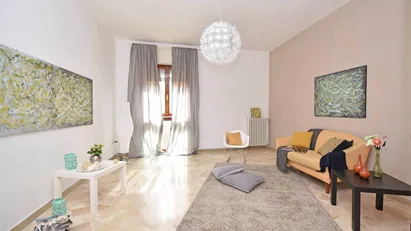
House for rent in West Midlands, 25 Hazelhurst Grove
9 h ago
House for rent in West Midlands, 25 Hazelhurst Grove
House for rent in West Midlands, 25 Hazelhurst Grove
House for rent in West Midlands, 25 Hazelhurst Grove
Rooms 3
House for rent in West Midlands, 25 Hazelhurst Grove
More info
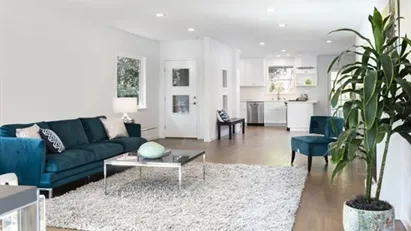
Apartment for rent in West Midlands, Street not specified
13 h ago
Apartment for rent in West Midlands, Street not specified
Apartment for rent in West Midlands, Street not specified
Apartment for rent in West Midlands, Street not specified
Rooms 2
Apartment for rent in West Midlands, Street not specified
More info
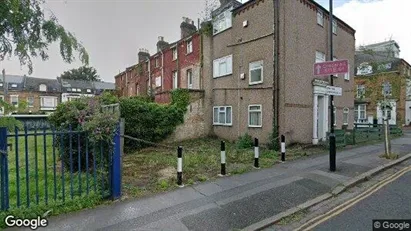
Apartment for rent in West Midlands, Street not specified
14 h ago
Apartment for rent in West Midlands, Street not specified
Apartment for rent in West Midlands, Street not specified
Apartment for rent in West Midlands, Street not specified
Rooms 1
Apartment for rent in West Midlands, Street not specified
More info
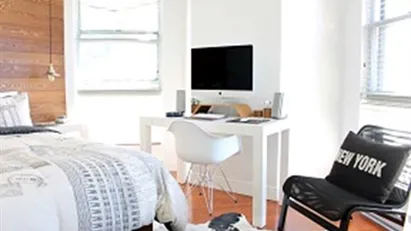
Room for rent in West Midlands, Hartington Road
14 h ago
Room for rent in West Midlands, Hartington Road
Room for rent in West Midlands, Hartington Road
Room for rent in West Midlands, Hartington Road
Room for rent in West Midlands, Hartington Road
More info
Room for rent in West Midlands, Sherriff Road
15 h ago
Room for rent in West Midlands, Sherriff Road
Room for rent in West Midlands, Sherriff Road
Room for rent in West Midlands, Sherriff Road
Room for rent in West Midlands, Sherriff Road
More info
Room for rent in West Midlands, West End Lane
15 h ago
Room for rent in West Midlands, West End Lane
Room for rent in West Midlands, West End Lane
Room for rent in West Midlands, West End Lane
Room for rent in West Midlands, West End Lane
More info
House for rent in West Midlands, Brassey Road
15 h ago
House for rent in West Midlands, Brassey Road
House for rent in West Midlands, Brassey Road
House for rent in West Midlands, Brassey Road
Rooms 3
House for rent in West Midlands, Brassey Road
More info
Room for rent in West Midlands, Mazenod Avenue
15 h ago
Room for rent in West Midlands, Mazenod Avenue
Room for rent in West Midlands, Mazenod Avenue
Room for rent in West Midlands, Mazenod Avenue
Room for rent in West Midlands, Mazenod Avenue
More info
Room for rent in West Midlands, Iverson Road
15 h ago
Room for rent in West Midlands, Iverson Road
Room for rent in West Midlands, Iverson Road
Room for rent in West Midlands, Iverson Road
Room for rent in West Midlands, Iverson Road
More info
Room for rent in West Midlands, Fortune Green Road
15 h ago
Room for rent in West Midlands, Fortune Green Road
Room for rent in West Midlands, Fortune Green Road
Room for rent in West Midlands, Fortune Green Road
Room for rent in West Midlands, Fortune Green Road
More info
Room for rent in West Midlands, Lowfield Road
15 h ago
Room for rent in West Midlands, Lowfield Road
Room for rent in West Midlands, Lowfield Road
Room for rent in West Midlands, Lowfield Road
Room for rent in West Midlands, Lowfield Road
More info
Room for rent in West Midlands, Gascony Avenue
15 h ago
Room for rent in West Midlands, Gascony Avenue
Room for rent in West Midlands, Gascony Avenue
Room for rent in West Midlands, Gascony Avenue
Room for rent in West Midlands, Gascony Avenue
More info
Room for rent in West Midlands, Inglewood Road
15 h ago
Room for rent in West Midlands, Inglewood Road
Room for rent in West Midlands, Inglewood Road
Room for rent in West Midlands, Inglewood Road
Room for rent in West Midlands, Inglewood Road
More info
Room for rent in West Midlands, Holmdale Road
15 h ago
Room for rent in West Midlands, Holmdale Road
Room for rent in West Midlands, Holmdale Road
Room for rent in West Midlands, Holmdale Road
Room for rent in West Midlands, Holmdale Road
More info
Room for rent in West Midlands, Inglewood Road
15 h ago
Room for rent in West Midlands, Inglewood Road
Room for rent in West Midlands, Inglewood Road
Room for rent in West Midlands, Inglewood Road
Room for rent in West Midlands, Inglewood Road
More info
Room for rent in West Midlands, West End Lane
15 h ago
Room for rent in West Midlands, West End Lane
Room for rent in West Midlands, West End Lane
Room for rent in West Midlands, West End Lane
Room for rent in West Midlands, West End Lane
More info
Room for rent in West Midlands, Elmcroft Garages
15 h ago
Room for rent in West Midlands, Elmcroft Garages
Room for rent in West Midlands, Elmcroft Garages
Room for rent in West Midlands, Elmcroft Garages
Room for rent in West Midlands, Elmcroft Garages
More info
Room for rent in West Midlands, Elmcroft Garages
15 h ago
Room for rent in West Midlands, Elmcroft Garages
Room for rent in West Midlands, Elmcroft Garages
Room for rent in West Midlands, Elmcroft Garages
Room for rent in West Midlands, Elmcroft Garages
More info