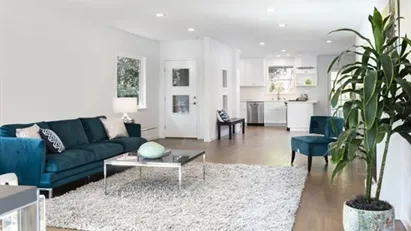
Ca. 65 m2 apartment for rent in Eindhoven, North Brabant, Frits Philipslaan
30 min ago
Ca. 65 m2 apartment for rent in Eindhoven, North Brabant, Frits Philipslaan
Ca. 65 m2 apartment for rent in Eindhoven, North Brabant, Frits Philipslaan
Ca. 65 m2 apartment for rent in Eindhoven, North Brabant, Frits Philipslaan
Ca. 65 m2 Rooms 2
Ca. 65 m2 apartment for rent in Eindhoven, North Brabant, Frits Philipslaan
More info
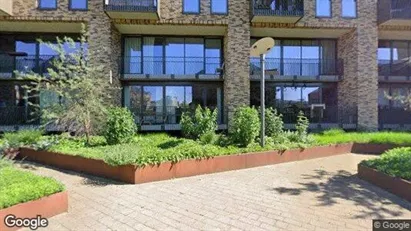
Ca. 70 m2 apartment for rent in Eindhoven, North Brabant, Frits Philipslaan
30 min ago
Ca. 70 m2 apartment for rent in Eindhoven, North Brabant, Frits Philipslaan
Ca. 70 m2 apartment for rent in Eindhoven, North Brabant, Frits Philipslaan
Ca. 70 m2 apartment for rent in Eindhoven, North Brabant, Frits Philipslaan
Ca. 70 m2 Rooms 2
Ca. 70 m2 apartment for rent in Eindhoven, North Brabant, Frits Philipslaan
More info
Ca. 65 m2 apartment for rent in Eindhoven, North Brabant, Anton Philipslaan
30 min ago
Ca. 65 m2 apartment for rent in Eindhoven, North Brabant, Anton Philipslaan
Ca. 65 m2 apartment for rent in Eindhoven, North Brabant, Anton Philipslaan
Ca. 65 m2 apartment for rent in Eindhoven, North Brabant, Anton Philipslaan
Ca. 65 m2 Rooms 2
Ca. 65 m2 apartment for rent in Eindhoven, North Brabant, Anton Philipslaan
More info
Ca. 75 m2 apartment for rent in Eindhoven, North Brabant, Treurenburgstraat
4 h ago
Ca. 75 m2 apartment for rent in Eindhoven, North Brabant, Treurenburgstraat
Ca. 75 m2 apartment for rent in Eindhoven, North Brabant, Treurenburgstraat
Ca. 75 m2 apartment for rent in Eindhoven, North Brabant, Treurenburgstraat
Ca. 75 m2 Rooms 3
Ca. 75 m2 apartment for rent in Eindhoven, North Brabant, Treurenburgstraat
More info
Ca. 90 m2 apartment for rent in Etten-Leur, North Brabant, Bernhardlaan
5 h ago
Ca. 90 m2 apartment for rent in Etten-Leur, North Brabant, Bernhardlaan
Ca. 90 m2 apartment for rent in Etten-Leur, North Brabant, Bernhardlaan
Ca. 90 m2 apartment for rent in Etten-Leur, North Brabant, Bernhardlaan
Ca. 90 m2 Rooms 3
Ca. 90 m2 apartment for rent in Etten-Leur, North Brabant, Bernhardlaan
More info
Ca. 115 m2 apartment for rent in Etten-Leur, North Brabant, Geerkade
5 h ago
Ca. 115 m2 apartment for rent in Etten-Leur, North Brabant, Geerkade
Ca. 115 m2 apartment for rent in Etten-Leur, North Brabant, Geerkade
Ca. 115 m2 apartment for rent in Etten-Leur, North Brabant, Geerkade
Ca. 115 m2 Rooms 3
Ca. 115 m2 apartment for rent in Etten-Leur, North Brabant, Geerkade
More info
Ca. 120 m2 apartment for rent in Meierijstad, North Brabant, Lambertushof
5 h ago
Ca. 120 m2 apartment for rent in Meierijstad, North Brabant, Lambertushof
Ca. 120 m2 apartment for rent in Meierijstad, North Brabant, Lambertushof
Ca. 120 m2 apartment for rent in Meierijstad, North Brabant, Lambertushof
Ca. 120 m2 Rooms 3
Ca. 120 m2 apartment for rent in Meierijstad, North Brabant, Lambertushof
More info
Ca. 85 m2 apartment for rent in Tilburg, North Brabant, Aphroditestraat
5 h ago
Ca. 85 m2 apartment for rent in Tilburg, North Brabant, Aphroditestraat
Ca. 85 m2 apartment for rent in Tilburg, North Brabant, Aphroditestraat
Ca. 85 m2 apartment for rent in Tilburg, North Brabant, Aphroditestraat
Ca. 85 m2
Ca. 85 m2 apartment for rent in Tilburg, North Brabant, Aphroditestraat
More info
Ca. 40 m2 apartment for rent in Breda, North Brabant, Haagdijk
5 h ago
Ca. 40 m2 apartment for rent in Breda, North Brabant, Haagdijk
Ca. 40 m2 apartment for rent in Breda, North Brabant, Haagdijk
Ca. 40 m2 apartment for rent in Breda, North Brabant, Haagdijk
Ca. 40 m2 Rooms 2
Ca. 40 m2 apartment for rent in Breda, North Brabant, Haagdijk
More info
Ca. 80 m2 apartment for rent in Roosendaal, North Brabant, Nieuwe Markt
6 h ago
Ca. 80 m2 apartment for rent in Roosendaal, North Brabant, Nieuwe Markt
Ca. 80 m2 apartment for rent in Roosendaal, North Brabant, Nieuwe Markt
Ca. 80 m2 apartment for rent in Roosendaal, North Brabant, Nieuwe Markt
Ca. 80 m2
Ca. 80 m2 apartment for rent in Roosendaal, North Brabant, Nieuwe Markt
More info
Ca. 95 m2 apartment for rent in Eindhoven, North Brabant, St Catharinastraat
8 h ago
Ca. 95 m2 apartment for rent in Eindhoven, North Brabant, St Catharinastraat
Ca. 95 m2 apartment for rent in Eindhoven, North Brabant, St Catharinastraat
Ca. 95 m2 apartment for rent in Eindhoven, North Brabant, St Catharinastraat
Ca. 95 m2
Ca. 95 m2 apartment for rent in Eindhoven, North Brabant, St Catharinastraat
More info
Ca. 50 m2 apartment for rent in Eindhoven, North Brabant, Wal
8 h ago
Ca. 50 m2 apartment for rent in Eindhoven, North Brabant, Wal
Ca. 50 m2 apartment for rent in Eindhoven, North Brabant, Wal
Ca. 50 m2 apartment for rent in Eindhoven, North Brabant, Wal
Ca. 50 m2
Ca. 50 m2 apartment for rent in Eindhoven, North Brabant, Wal
More info
Ca. 100 m2 apartment for rent in Breda, North Brabant, Beyerd
8 h ago
Ca. 100 m2 apartment for rent in Breda, North Brabant, Beyerd
Ca. 100 m2 apartment for rent in Breda, North Brabant, Beyerd
Ca. 100 m2 apartment for rent in Breda, North Brabant, Beyerd
Ca. 100 m2
Ca. 100 m2 apartment for rent in Breda, North Brabant, Beyerd
More info
Ca. 120 m2 apartment for rent in Eindhoven, North Brabant, Tramstraat
8 h ago
Ca. 120 m2 apartment for rent in Eindhoven, North Brabant, Tramstraat
Ca. 120 m2 apartment for rent in Eindhoven, North Brabant, Tramstraat
Ca. 120 m2 apartment for rent in Eindhoven, North Brabant, Tramstraat
Ca. 120 m2
Ca. 120 m2 apartment for rent in Eindhoven, North Brabant, Tramstraat
More info
Ca. 95 m2 apartment for rent in Etten-Leur, North Brabant, Roosendaalseweg
8 h ago
Ca. 95 m2 apartment for rent in Etten-Leur, North Brabant, Roosendaalseweg
Ca. 95 m2 apartment for rent in Etten-Leur, North Brabant, Roosendaalseweg
Ca. 95 m2 apartment for rent in Etten-Leur, North Brabant, Roosendaalseweg
Ca. 95 m2
Ca. 95 m2 apartment for rent in Etten-Leur, North Brabant, Roosendaalseweg
More info
Ca. 65 m2 apartment for rent in Breda, North Brabant, Stadserf
8 h ago
Ca. 65 m2 apartment for rent in Breda, North Brabant, Stadserf
Ca. 65 m2 apartment for rent in Breda, North Brabant, Stadserf
Ca. 65 m2 apartment for rent in Breda, North Brabant, Stadserf
Ca. 65 m2
Ca. 65 m2 apartment for rent in Breda, North Brabant, Stadserf
More info
Ca. 120 m2 apartment for rent in Eindhoven, North Brabant, Juliusstraat
8 h ago
Ca. 120 m2 apartment for rent in Eindhoven, North Brabant, Juliusstraat
Ca. 120 m2 apartment for rent in Eindhoven, North Brabant, Juliusstraat
Ca. 120 m2 apartment for rent in Eindhoven, North Brabant, Juliusstraat
Ca. 120 m2
Ca. 120 m2 apartment for rent in Eindhoven, North Brabant, Juliusstraat
More info