Houses for rent in Montigny-le-Tilleul
See available rental houses in Montigny-le-Tilleul below. If you are interested in renting housing from the list below, click on the headline to proceed. Good luck with your search for your new rental home! More information about rental housing in Montigny-le-Tilleul.
Housingtarget.com today:
New today 6,545
Updated 24h 7,677
Notifications about new homes 22,037
Copenhagen +38
Stockholm +64
Amsterdam +7
Berlin +7
Zürich +7
Brussels +168
Vienna +114
Paris +13
Madrid +7
Dublin (county) +4
Warsaw +39
Rome +6
Lisbon +2
Greater London +297
Latest update 8 min ago
Active ads 511,437
2 rentals
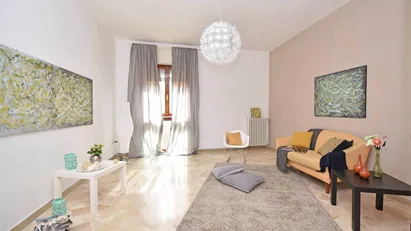
| Ca. 75 m2 house for rent in Montigny-le-Tilleul, Henegouwen, Street not specified 10 d ago |
Ca. 75 m2 house for rent in Montigny-le-Tilleul, Henegouwen, Street not specified
|
Ca. 75 m2 house for rent in Montigny-le-Tilleul, Henegouwen, Street not specified
Ca. 75 m2 house for rent in Montigny-le-Tilleul, Henegouwen, Street not specified
Ca. 75 m2 Rooms 1
|
Ca. 75 m2 house for rent in Montigny-le-Tilleul, Henegouwen, Street not specified
Ca. 900 EUR
|
More info |
| Ca. 180 m2 house for rent in Montigny-le-Tilleul, Henegouwen, Rue du Corby 2 mo ago |
Ca. 180 m2 house for rent in Montigny-le-Tilleul, Henegouwen, Rue du Corby
|
Ca. 180 m2 house for rent in Montigny-le-Tilleul, Henegouwen, Rue du Corby
Ca. 180 m2 house for rent in Montigny-le-Tilleul, Henegouwen, Rue du Corby
Ca. 180 m2 Rooms 4
|
Ca. 180 m2 house for rent in Montigny-le-Tilleul, Henegouwen, Rue du Corby
Not specified
|
More info |