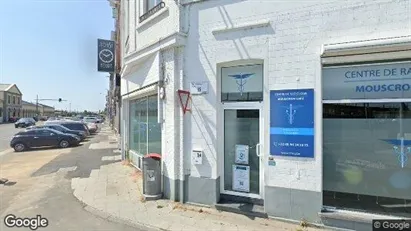
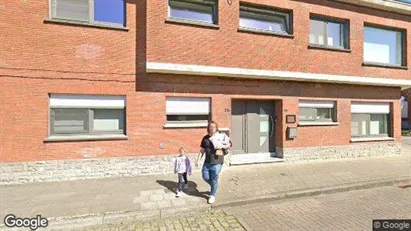
Ca. 85 m2 apartment for rent in Moeskroen, Henegouwen, Place de la Gare
6 h ago
Ca. 85 m2 apartment for rent in Moeskroen, Henegouwen, Place de la Gare
Ca. 85 m2 apartment for rent in Moeskroen, Henegouwen, Place de la Gare
Ca. 85 m2 apartment for rent in Moeskroen, Henegouwen, Place de la Gare
Ca. 85 m2
Ca. 85 m2 apartment for rent in Moeskroen, Henegouwen, Place de la Gare
More info
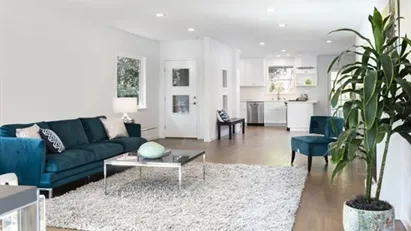
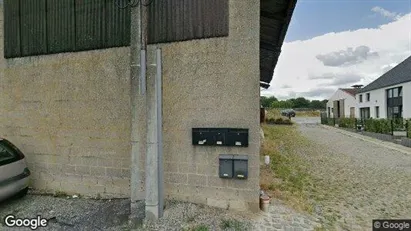
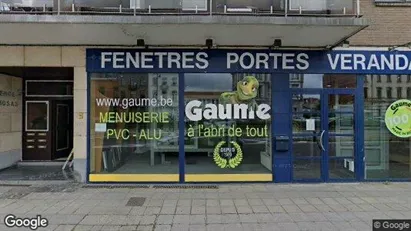
Ca. 8,600 m2 apartment for rent in Thuin, Henegouwen, Street not specified
6 h ago
Ca. 8,600 m2 apartment for rent in Thuin, Henegouwen, Street not specified
Ca. 8,600 m2 apartment for rent in Thuin, Henegouwen, Street not specified
Ca. 8,600 m2 apartment for rent in Thuin, Henegouwen, Street not specified
Ca. 8,600 m2 Rooms 2
Ca. 8,600 m2 apartment for rent in Thuin, Henegouwen, Street not specified
More info
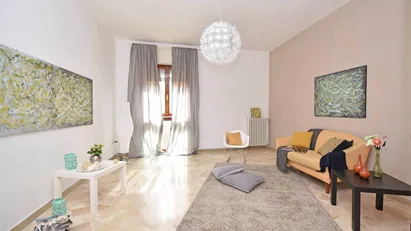
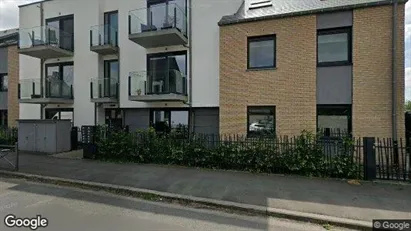
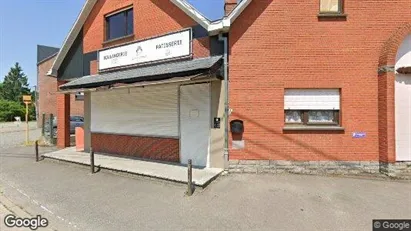
Ca. 120 m2 apartment for rent in Bernissart, Henegouwen, Street not specified
6 h ago
Ca. 120 m2 apartment for rent in Bernissart, Henegouwen, Street not specified
Ca. 120 m2 apartment for rent in Bernissart, Henegouwen, Street not specified
Ca. 120 m2 apartment for rent in Bernissart, Henegouwen, Street not specified
Ca. 120 m2
Ca. 120 m2 apartment for rent in Bernissart, Henegouwen, Street not specified
More info
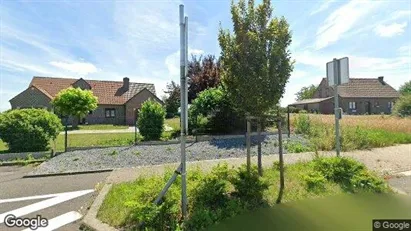
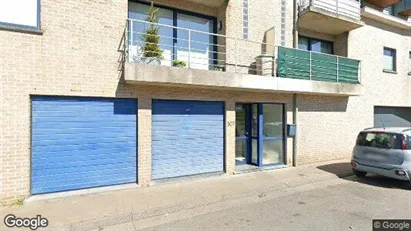
House for rent in Charleroi, Henegouwen, Street not specified
6 h ago
House for rent in Charleroi, Henegouwen, Street not specified
House for rent in Charleroi, Henegouwen, Street not specified
House for rent in Charleroi, Henegouwen, Street not specified
Rooms 3
House for rent in Charleroi, Henegouwen, Street not specified
More info
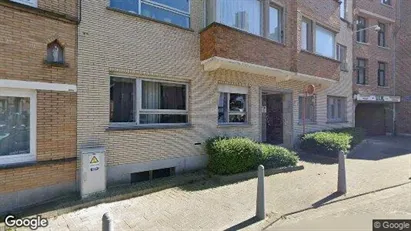
House for rent in Charleroi, Henegouwen, Rue du Roton
9 h ago
House for rent in Charleroi, Henegouwen, Rue du Roton
House for rent in Charleroi, Henegouwen, Rue du Roton
House for rent in Charleroi, Henegouwen, Rue du Roton
Rooms 2
House for rent in Charleroi, Henegouwen, Rue du Roton
More info
Apartment for rent in Les Bons Villers, Henegouwen, Chaussée de Bruxelles
9 h ago
Apartment for rent in Les Bons Villers, Henegouwen, Chaussée de Bruxelles
Apartment for rent in Les Bons Villers, Henegouwen, Chaussée de Bruxelles
Apartment for rent in Les Bons Villers, Henegouwen, Chaussée de Bruxelles
Rooms 2
Apartment for rent in Les Bons Villers, Henegouwen, Chaussée de Bruxelles
More info
Apartment for rent in Frasnes-lez-Anvaing, Henegouwen, Rue Bousée
9 h ago
Apartment for rent in Frasnes-lez-Anvaing, Henegouwen, Rue Bousée
Apartment for rent in Frasnes-lez-Anvaing, Henegouwen, Rue Bousée
Apartment for rent in Frasnes-lez-Anvaing, Henegouwen, Rue Bousée
Rooms 2
Apartment for rent in Frasnes-lez-Anvaing, Henegouwen, Rue Bousée
More info
Apartment for rent in Charleroi, Henegouwen, Rue Remoncheval (Nord) - Rue Paul Pastur (Sud)
9 h ago
Apartment for rent in Charleroi, Henegouwen, Rue Remoncheval (Nord) - Rue Paul Pastur (Sud)
Apartment for rent in Charleroi, Henegouwen, Rue Remoncheval (Nord) - Rue Paul Pastur (Sud)
Apartment for rent in Charleroi, Henegouwen, Rue Remoncheval (Nord) - Rue Paul Pastur (Sud)
Rooms 3
Apartment for rent in Charleroi, Henegouwen, Rue Remoncheval (Nord) - Rue Paul Pastur (Sud)
More info
Apartment for rent in Saint-Ghislain, Henegouwen, Rue Du Peuple
9 h ago
Apartment for rent in Saint-Ghislain, Henegouwen, Rue Du Peuple
Apartment for rent in Saint-Ghislain, Henegouwen, Rue Du Peuple
Apartment for rent in Saint-Ghislain, Henegouwen, Rue Du Peuple
Rooms 2
Apartment for rent in Saint-Ghislain, Henegouwen, Rue Du Peuple
More info
Apartment for rent in Moeskroen, Henegouwen, Rue de la Marlière
9 h ago
Apartment for rent in Moeskroen, Henegouwen, Rue de la Marlière
Apartment for rent in Moeskroen, Henegouwen, Rue de la Marlière
Apartment for rent in Moeskroen, Henegouwen, Rue de la Marlière
Rooms 2
Apartment for rent in Moeskroen, Henegouwen, Rue de la Marlière
More info
Apartment for rent in Moeskroen, Henegouwen, rue de lAbbé Coulon
9 h ago
Apartment for rent in Moeskroen, Henegouwen, rue de lAbbé Coulon
Apartment for rent in Moeskroen, Henegouwen, rue de lAbbé Coulon
Apartment for rent in Moeskroen, Henegouwen, rue de lAbbé Coulon
Rooms 2
Apartment for rent in Moeskroen, Henegouwen, rue de lAbbé Coulon
More info
House for rent in Edingen, Henegouwen, Brunehaultsteenweg
9 h ago
House for rent in Edingen, Henegouwen, Brunehaultsteenweg
House for rent in Edingen, Henegouwen, Brunehaultsteenweg
House for rent in Edingen, Henegouwen, Brunehaultsteenweg
Rooms 3
House for rent in Edingen, Henegouwen, Brunehaultsteenweg
More info
Apartment for rent in Moeskroen, Henegouwen, Rue de la Solidarité
9 h ago
Apartment for rent in Moeskroen, Henegouwen, Rue de la Solidarité
Apartment for rent in Moeskroen, Henegouwen, Rue de la Solidarité
Apartment for rent in Moeskroen, Henegouwen, Rue de la Solidarité
Rooms 2
Apartment for rent in Moeskroen, Henegouwen, Rue de la Solidarité
More info
House for rent in Beloeil, Henegouwen, Rue du Docteur Roland
9 h ago
House for rent in Beloeil, Henegouwen, Rue du Docteur Roland
House for rent in Beloeil, Henegouwen, Rue du Docteur Roland
House for rent in Beloeil, Henegouwen, Rue du Docteur Roland
Rooms 3
House for rent in Beloeil, Henegouwen, Rue du Docteur Roland
More info
House for rent in Erquelinnes, Henegouwen, Rue de Bersillies
9 h ago
House for rent in Erquelinnes, Henegouwen, Rue de Bersillies
House for rent in Erquelinnes, Henegouwen, Rue de Bersillies
House for rent in Erquelinnes, Henegouwen, Rue de Bersillies
Rooms 2
House for rent in Erquelinnes, Henegouwen, Rue de Bersillies
More info
House for rent in Thuin, Henegouwen, Rue Bethléem
9 h ago
House for rent in Thuin, Henegouwen, Rue Bethléem
House for rent in Thuin, Henegouwen, Rue Bethléem
House for rent in Thuin, Henegouwen, Rue Bethléem
Rooms 3
House for rent in Thuin, Henegouwen, Rue Bethléem
More info
Apartment for rent in Bergen, Henegouwen, Boulevard Sainctelette
9 h ago
Apartment for rent in Bergen, Henegouwen, Boulevard Sainctelette
Apartment for rent in Bergen, Henegouwen, Boulevard Sainctelette
Apartment for rent in Bergen, Henegouwen, Boulevard Sainctelette
Rooms 3
Apartment for rent in Bergen, Henegouwen, Boulevard Sainctelette
More info
Apartment for rent in Aat, Henegouwen, Chemin Cambry
9 h ago
Apartment for rent in Aat, Henegouwen, Chemin Cambry
Apartment for rent in Aat, Henegouwen, Chemin Cambry
Apartment for rent in Aat, Henegouwen, Chemin Cambry
Rooms 2
Apartment for rent in Aat, Henegouwen, Chemin Cambry
More info