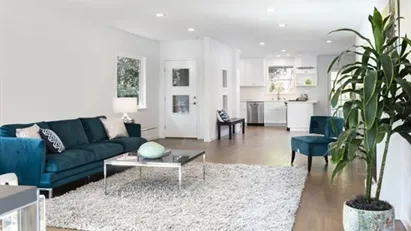
House for rent in Zaventem, Vlaams-Brabant, Du Roy de Blicquylaan
40 min ago
House for rent in Zaventem, Vlaams-Brabant, Du Roy de Blicquylaan
House for rent in Zaventem, Vlaams-Brabant, Du Roy de Blicquylaan
House for rent in Zaventem, Vlaams-Brabant, Du Roy de Blicquylaan
Rooms 5
House for rent in Zaventem, Vlaams-Brabant, Du Roy de Blicquylaan
More info
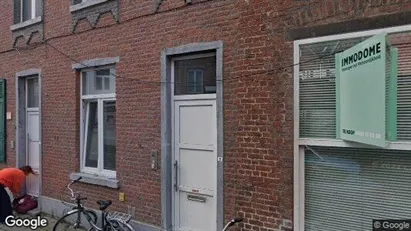
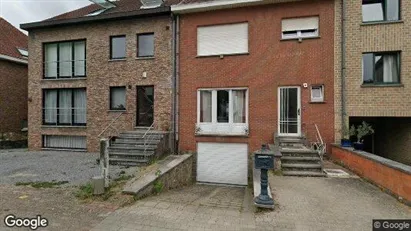
House for rent in Wezembeek-Oppem, Vlaams-Brabant, Rue de la Limite
40 min ago
House for rent in Wezembeek-Oppem, Vlaams-Brabant, Rue de la Limite
House for rent in Wezembeek-Oppem, Vlaams-Brabant, Rue de la Limite
House for rent in Wezembeek-Oppem, Vlaams-Brabant, Rue de la Limite
Rooms 4
House for rent in Wezembeek-Oppem, Vlaams-Brabant, Rue de la Limite
More info
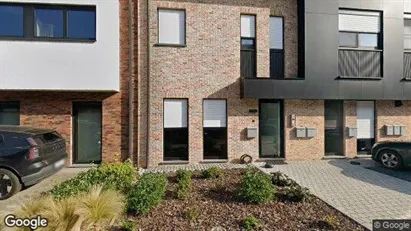
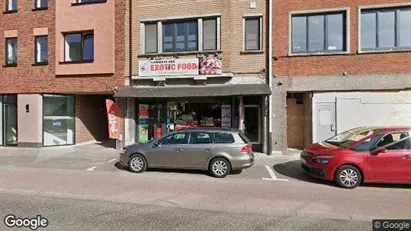
House for rent in Overijse, Vlaams-Brabant, Borrestraat
40 min ago
House for rent in Overijse, Vlaams-Brabant, Borrestraat
House for rent in Overijse, Vlaams-Brabant, Borrestraat
House for rent in Overijse, Vlaams-Brabant, Borrestraat
Rooms 3
House for rent in Overijse, Vlaams-Brabant, Borrestraat
More info
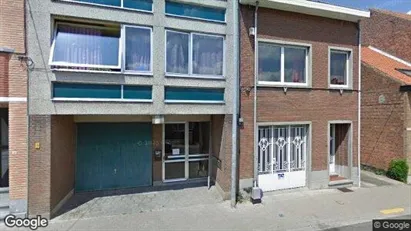
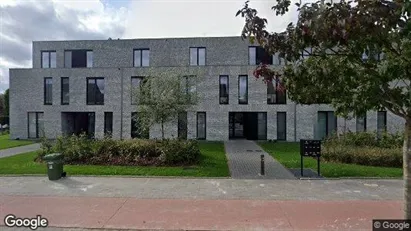
House for rent in Gooik, Vlaams-Brabant, Asseveldstraat
40 min ago
House for rent in Gooik, Vlaams-Brabant, Asseveldstraat
House for rent in Gooik, Vlaams-Brabant, Asseveldstraat
House for rent in Gooik, Vlaams-Brabant, Asseveldstraat
Rooms 3
House for rent in Gooik, Vlaams-Brabant, Asseveldstraat
More info
House for rent in Tervuren, Vlaams-Brabant, Overijsesteenweg
40 min ago
House for rent in Tervuren, Vlaams-Brabant, Overijsesteenweg
House for rent in Tervuren, Vlaams-Brabant, Overijsesteenweg
House for rent in Tervuren, Vlaams-Brabant, Overijsesteenweg
Rooms 5
House for rent in Tervuren, Vlaams-Brabant, Overijsesteenweg
More info
House for rent in Halle, Vlaams-Brabant, Oude Groenweg
40 min ago
House for rent in Halle, Vlaams-Brabant, Oude Groenweg
House for rent in Halle, Vlaams-Brabant, Oude Groenweg
House for rent in Halle, Vlaams-Brabant, Oude Groenweg
Rooms 5
House for rent in Halle, Vlaams-Brabant, Oude Groenweg
More info
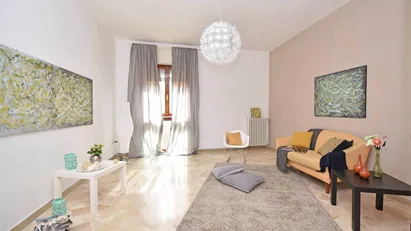
Apartment for rent in Leuven, Vlaams-Brabant, Augustijnenstraat
40 min ago
Apartment for rent in Leuven, Vlaams-Brabant, Augustijnenstraat
Apartment for rent in Leuven, Vlaams-Brabant, Augustijnenstraat
Apartment for rent in Leuven, Vlaams-Brabant, Augustijnenstraat
Apartment for rent in Leuven, Vlaams-Brabant, Augustijnenstraat
More info
Apartment for rent in Leuven, Vlaams-Brabant, Weggevoerdenstraat
40 min ago
Apartment for rent in Leuven, Vlaams-Brabant, Weggevoerdenstraat
Apartment for rent in Leuven, Vlaams-Brabant, Weggevoerdenstraat
Apartment for rent in Leuven, Vlaams-Brabant, Weggevoerdenstraat
Rooms 2
Apartment for rent in Leuven, Vlaams-Brabant, Weggevoerdenstraat
More info
Apartment for rent in Leuven, Vlaams-Brabant, Ijzerenmolenstraat
41 min ago
Apartment for rent in Leuven, Vlaams-Brabant, Ijzerenmolenstraat
Apartment for rent in Leuven, Vlaams-Brabant, Ijzerenmolenstraat
Apartment for rent in Leuven, Vlaams-Brabant, Ijzerenmolenstraat
Rooms 1
Apartment for rent in Leuven, Vlaams-Brabant, Ijzerenmolenstraat
More info
Apartment for rent in Leuven, Vlaams-Brabant, Augustijnenstraat
42 min ago
Apartment for rent in Leuven, Vlaams-Brabant, Augustijnenstraat
Apartment for rent in Leuven, Vlaams-Brabant, Augustijnenstraat
Apartment for rent in Leuven, Vlaams-Brabant, Augustijnenstraat
Rooms 2
Apartment for rent in Leuven, Vlaams-Brabant, Augustijnenstraat
More info
Apartment for rent in Hoeilaart, Vlaams-Brabant, Kasteelstraat
42 min ago
Apartment for rent in Hoeilaart, Vlaams-Brabant, Kasteelstraat
Apartment for rent in Hoeilaart, Vlaams-Brabant, Kasteelstraat
Apartment for rent in Hoeilaart, Vlaams-Brabant, Kasteelstraat
Rooms 2
Apartment for rent in Hoeilaart, Vlaams-Brabant, Kasteelstraat
More info
Apartment for rent in Leuven, Vlaams-Brabant, Diestsesteenweg
44 min ago
Apartment for rent in Leuven, Vlaams-Brabant, Diestsesteenweg
Apartment for rent in Leuven, Vlaams-Brabant, Diestsesteenweg
Apartment for rent in Leuven, Vlaams-Brabant, Diestsesteenweg
Rooms 1
Apartment for rent in Leuven, Vlaams-Brabant, Diestsesteenweg
More info
House for rent in Tervuren, Vlaams-Brabant, Achterstraat
44 min ago
House for rent in Tervuren, Vlaams-Brabant, Achterstraat
House for rent in Tervuren, Vlaams-Brabant, Achterstraat
House for rent in Tervuren, Vlaams-Brabant, Achterstraat
Rooms 4
House for rent in Tervuren, Vlaams-Brabant, Achterstraat
More info
Apartment for rent in Leuven, Vlaams-Brabant, Aarschotsesteenweg
44 min ago
Apartment for rent in Leuven, Vlaams-Brabant, Aarschotsesteenweg
Apartment for rent in Leuven, Vlaams-Brabant, Aarschotsesteenweg
Apartment for rent in Leuven, Vlaams-Brabant, Aarschotsesteenweg
Rooms 3
Apartment for rent in Leuven, Vlaams-Brabant, Aarschotsesteenweg
More info
House for rent in Kraainem, Vlaams-Brabant, Avenue des Tarins
44 min ago
House for rent in Kraainem, Vlaams-Brabant, Avenue des Tarins
House for rent in Kraainem, Vlaams-Brabant, Avenue des Tarins
House for rent in Kraainem, Vlaams-Brabant, Avenue des Tarins
Rooms 4
House for rent in Kraainem, Vlaams-Brabant, Avenue des Tarins
More info
House for rent in Tervuren, Vlaams-Brabant, Moorselstraat
44 min ago
House for rent in Tervuren, Vlaams-Brabant, Moorselstraat
House for rent in Tervuren, Vlaams-Brabant, Moorselstraat
House for rent in Tervuren, Vlaams-Brabant, Moorselstraat
Rooms 3
House for rent in Tervuren, Vlaams-Brabant, Moorselstraat
More info
Apartment for rent in Hoeilaart, Vlaams-Brabant, Albert Biesmanslaan
44 min ago
Apartment for rent in Hoeilaart, Vlaams-Brabant, Albert Biesmanslaan
Apartment for rent in Hoeilaart, Vlaams-Brabant, Albert Biesmanslaan
Apartment for rent in Hoeilaart, Vlaams-Brabant, Albert Biesmanslaan
Rooms 2
Apartment for rent in Hoeilaart, Vlaams-Brabant, Albert Biesmanslaan
More info
Apartment for rent in Wezembeek-Oppem, Vlaams-Brabant, Rue Gergel
45 min ago
Apartment for rent in Wezembeek-Oppem, Vlaams-Brabant, Rue Gergel
Apartment for rent in Wezembeek-Oppem, Vlaams-Brabant, Rue Gergel
Apartment for rent in Wezembeek-Oppem, Vlaams-Brabant, Rue Gergel
Rooms 1
Apartment for rent in Wezembeek-Oppem, Vlaams-Brabant, Rue Gergel
More info