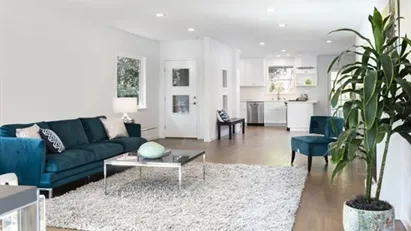
Apartment for rent in East Midlands, St Elmo Gove
3 h ago
Apartment for rent in East Midlands, St Elmo Gove
Apartment for rent in East Midlands, St Elmo Gove
Apartment for rent in East Midlands, St Elmo Gove
Rooms 3
Apartment for rent in East Midlands, St Elmo Gove
More info
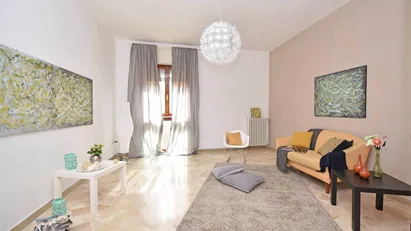
House for rent in Nottingham - Nottinghamshire, East Midlands, Nelson Street
15 h ago
House for rent in Nottingham - Nottinghamshire, East Midlands, Nelson Street
House for rent in Nottingham - Nottinghamshire, East Midlands, Nelson Street
House for rent in Nottingham - Nottinghamshire, East Midlands, Nelson Street
Rooms 2
House for rent in Nottingham - Nottinghamshire, East Midlands, Nelson Street
More info
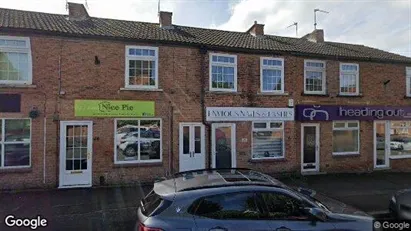
House for rent in Nottingham - Nottinghamshire, East Midlands, Lindley Street
15 h ago
House for rent in Nottingham - Nottinghamshire, East Midlands, Lindley Street
House for rent in Nottingham - Nottinghamshire, East Midlands, Lindley Street
House for rent in Nottingham - Nottinghamshire, East Midlands, Lindley Street
Rooms 3
House for rent in Nottingham - Nottinghamshire, East Midlands, Lindley Street
More info
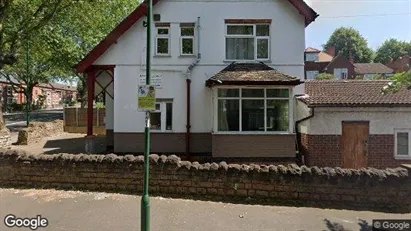
Apartment for rent in Nottingham - Nottinghamshire, East Midlands, Room
16 h ago
Apartment for rent in Nottingham - Nottinghamshire, East Midlands, Room
Apartment for rent in Nottingham - Nottinghamshire, East Midlands, Room
Apartment for rent in Nottingham - Nottinghamshire, East Midlands, Room
Rooms 1
Apartment for rent in Nottingham - Nottinghamshire, East Midlands, Room
More info
House for rent in Nottingham - Nottinghamshire, East Midlands, Street not specified
16 h ago
House for rent in Nottingham - Nottinghamshire, East Midlands, Street not specified
House for rent in Nottingham - Nottinghamshire, East Midlands, Street not specified
House for rent in Nottingham - Nottinghamshire, East Midlands, Street not specified
Rooms 6
House for rent in Nottingham - Nottinghamshire, East Midlands, Street not specified
More info
House for rent in Nottingham - Nottinghamshire, East Midlands, Street not specified
16 h ago
House for rent in Nottingham - Nottinghamshire, East Midlands, Street not specified
House for rent in Nottingham - Nottinghamshire, East Midlands, Street not specified
House for rent in Nottingham - Nottinghamshire, East Midlands, Street not specified
Rooms 4
House for rent in Nottingham - Nottinghamshire, East Midlands, Street not specified
More info
Apartment for rent in Nottingham - Nottinghamshire, East Midlands, Nottingham
19 h ago
Apartment for rent in Nottingham - Nottinghamshire, East Midlands, Nottingham
Apartment for rent in Nottingham - Nottinghamshire, East Midlands, Nottingham
Apartment for rent in Nottingham - Nottinghamshire, East Midlands, Nottingham
Apartment for rent in Nottingham - Nottinghamshire, East Midlands, Nottingham
More info
Apartment for rent in Nottingham - Nottinghamshire, East Midlands, Redcliffe Road, Mapperley, Mapperley, Nottingham, NG3
22 h ago
Apartment for rent in Nottingham - Nottinghamshire, East Midlands, Redcliffe Road, Mapperley, Mapperley, Nottingham, NG3
Apartment for rent in Nottingham - Nottinghamshire, East Midlands, Redcliffe Road, Mapperley, Mapperley, Nottingham, NG3
Apartment for rent in Nottingham - Nottinghamshire, East Midlands, Redcliffe Road, Mapperley, Mapperley, Nottingham, NG3
Apartment for rent in Nottingham - Nottinghamshire, East Midlands, Redcliffe Road, Mapperley, Mapperley, Nottingham, NG3
More info
Apartment for rent in Nottingham - Nottinghamshire, East Midlands, Zulla Road, Nottingham, Carrington, NG3
22 h ago
Apartment for rent in Nottingham - Nottinghamshire, East Midlands, Zulla Road, Nottingham, Carrington, NG3
Apartment for rent in Nottingham - Nottinghamshire, East Midlands, Zulla Road, Nottingham, Carrington, NG3
Apartment for rent in Nottingham - Nottinghamshire, East Midlands, Zulla Road, Nottingham, Carrington, NG3
Apartment for rent in Nottingham - Nottinghamshire, East Midlands, Zulla Road, Nottingham, Carrington, NG3
More info
House for rent in Nottingham - Nottinghamshire, East Midlands, Valley Road, Sherwood Nottingham, NG5
22 h ago
House for rent in Nottingham - Nottinghamshire, East Midlands, Valley Road, Sherwood Nottingham, NG5
House for rent in Nottingham - Nottinghamshire, East Midlands, Valley Road, Sherwood Nottingham, NG5
House for rent in Nottingham - Nottinghamshire, East Midlands, Valley Road, Sherwood Nottingham, NG5
House for rent in Nottingham - Nottinghamshire, East Midlands, Valley Road, Sherwood Nottingham, NG5
More info
Apartment for rent in Nottingham - Nottinghamshire, East Midlands, Castle Edge
1 d ago
Apartment for rent in Nottingham - Nottinghamshire, East Midlands, Castle Edge
Apartment for rent in Nottingham - Nottinghamshire, East Midlands, Castle Edge
Apartment for rent in Nottingham - Nottinghamshire, East Midlands, Castle Edge
Rooms 2
Apartment for rent in Nottingham - Nottinghamshire, East Midlands, Castle Edge
More info
Apartment for rent in Nottingham - Nottinghamshire, East Midlands, Bingham Road
1 d ago
Apartment for rent in Nottingham - Nottinghamshire, East Midlands, Bingham Road
Apartment for rent in Nottingham - Nottinghamshire, East Midlands, Bingham Road
Apartment for rent in Nottingham - Nottinghamshire, East Midlands, Bingham Road
Rooms 1
Apartment for rent in Nottingham - Nottinghamshire, East Midlands, Bingham Road
More info
Apartment for rent in Nottingham - Nottinghamshire, East Midlands, Derby Road
1 d ago
Apartment for rent in Nottingham - Nottinghamshire, East Midlands, Derby Road
Apartment for rent in Nottingham - Nottinghamshire, East Midlands, Derby Road
Apartment for rent in Nottingham - Nottinghamshire, East Midlands, Derby Road
Rooms 2
Apartment for rent in Nottingham - Nottinghamshire, East Midlands, Derby Road
More info
Apartment for rent in Nottingham - Nottinghamshire, East Midlands, Beaconsfield Road
1 d ago
Apartment for rent in Nottingham - Nottinghamshire, East Midlands, Beaconsfield Road
Apartment for rent in Nottingham - Nottinghamshire, East Midlands, Beaconsfield Road
Apartment for rent in Nottingham - Nottinghamshire, East Midlands, Beaconsfield Road
Rooms 1
Apartment for rent in Nottingham - Nottinghamshire, East Midlands, Beaconsfield Road
More info
Apartment for rent in Nottingham - Nottinghamshire, East Midlands, Castle Edge
1 d ago
Apartment for rent in Nottingham - Nottinghamshire, East Midlands, Castle Edge
Apartment for rent in Nottingham - Nottinghamshire, East Midlands, Castle Edge
Apartment for rent in Nottingham - Nottinghamshire, East Midlands, Castle Edge
Rooms 1
Apartment for rent in Nottingham - Nottinghamshire, East Midlands, Castle Edge
More info
Apartment for rent in Nottingham - Nottinghamshire, East Midlands, North Sherwood Street
1 d ago
Apartment for rent in Nottingham - Nottinghamshire, East Midlands, North Sherwood Street
Apartment for rent in Nottingham - Nottinghamshire, East Midlands, North Sherwood Street
Apartment for rent in Nottingham - Nottinghamshire, East Midlands, North Sherwood Street
Rooms 2
Apartment for rent in Nottingham - Nottinghamshire, East Midlands, North Sherwood Street
More info