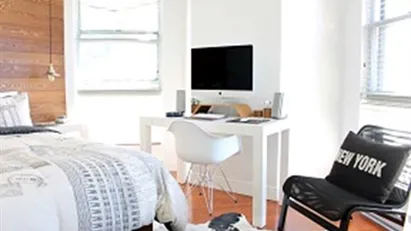
Room for rent in Salamanca, Castilla y León, Calle San Ambrosio
7 h ago
Room for rent in Salamanca, Castilla y León, Calle San Ambrosio
Room for rent in Salamanca, Castilla y León, Calle San Ambrosio
Room for rent in Salamanca, Castilla y León, Calle San Ambrosio
Room for rent in Salamanca, Castilla y León, Calle San Ambrosio
More info
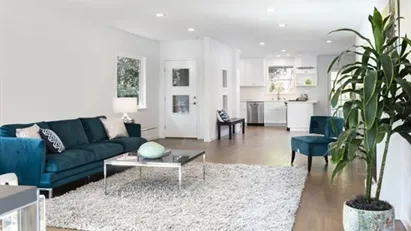
Ca. 65 m2 apartment for rent in Salamanca, Castilla y León, Madrid (Barrio de Salamanca)
14 h ago
Ca. 65 m2 apartment for rent in Salamanca, Castilla y León, Madrid (Barrio de Salamanca)
Ca. 65 m2 apartment for rent in Salamanca, Castilla y León, Madrid (Barrio de Salamanca)
Ca. 65 m2 apartment for rent in Salamanca, Castilla y León, Madrid (Barrio de Salamanca)
Ca. 65 m2 Rooms 1
Ca. 65 m2 apartment for rent in Salamanca, Castilla y León, Madrid (Barrio de Salamanca)
More info
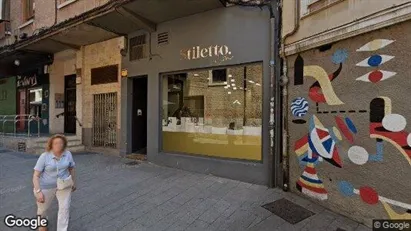
Ca. 70 m2 apartment for rent in Salamanca, Castilla y León, Madrid (Barrio de Salamanca)
14 h ago
Ca. 70 m2 apartment for rent in Salamanca, Castilla y León, Madrid (Barrio de Salamanca)
Ca. 70 m2 apartment for rent in Salamanca, Castilla y León, Madrid (Barrio de Salamanca)
Ca. 70 m2 apartment for rent in Salamanca, Castilla y León, Madrid (Barrio de Salamanca)
Ca. 70 m2 Rooms 2
Ca. 70 m2 apartment for rent in Salamanca, Castilla y León, Madrid (Barrio de Salamanca)
More info
Ca. 90 m2 apartment for rent in Chamartín, Castilla y León, Madrid (Chamartín)
14 h ago
Ca. 90 m2 apartment for rent in Chamartín, Castilla y León, Madrid (Chamartín)
Ca. 90 m2 apartment for rent in Chamartín, Castilla y León, Madrid (Chamartín)
Ca. 90 m2 apartment for rent in Chamartín, Castilla y León, Madrid (Chamartín)
Ca. 90 m2 Rooms 3
Ca. 90 m2 apartment for rent in Chamartín, Castilla y León, Madrid (Chamartín)
More info
Ca. 35 m2 apartment for rent in Salamanca, Castilla y León, Madrid (Barrio de Salamanca)
14 h ago
Ca. 35 m2 apartment for rent in Salamanca, Castilla y León, Madrid (Barrio de Salamanca)
Ca. 35 m2 apartment for rent in Salamanca, Castilla y León, Madrid (Barrio de Salamanca)
Ca. 35 m2 apartment for rent in Salamanca, Castilla y León, Madrid (Barrio de Salamanca)
Ca. 35 m2
Ca. 35 m2 apartment for rent in Salamanca, Castilla y León, Madrid (Barrio de Salamanca)
More info
Ca. 55 m2 apartment for rent in Salamanca, Castilla y León, Street not specified
14 h ago
Ca. 55 m2 apartment for rent in Salamanca, Castilla y León, Street not specified
Ca. 55 m2 apartment for rent in Salamanca, Castilla y León, Street not specified
Ca. 55 m2 apartment for rent in Salamanca, Castilla y León, Street not specified
Ca. 55 m2 Rooms 2
Ca. 55 m2 apartment for rent in Salamanca, Castilla y León, Street not specified
More info
Ca. 15 m2 room for rent in Salamanca, Castilla y León, Avenida de los Maristas
8 h ago
Ca. 15 m2 room for rent in Salamanca, Castilla y León, Avenida de los Maristas
Ca. 15 m2 room for rent in Salamanca, Castilla y León, Avenida de los Maristas
Ca. 15 m2 room for rent in Salamanca, Castilla y León, Avenida de los Maristas
Ca. 15 m2
Ca. 15 m2 room for rent in Salamanca, Castilla y León, Avenida de los Maristas
More info
Ca. 15 m2 room for rent in Salamanca, Castilla y León, Calle Maestro Ávila
8 h ago
Ca. 15 m2 room for rent in Salamanca, Castilla y León, Calle Maestro Ávila
Ca. 15 m2 room for rent in Salamanca, Castilla y León, Calle Maestro Ávila
Ca. 15 m2 room for rent in Salamanca, Castilla y León, Calle Maestro Ávila
Ca. 15 m2
Ca. 15 m2 room for rent in Salamanca, Castilla y León, Calle Maestro Ávila
More info
Apartment for rent in San Pascual, Castilla y León, Street not specified
15 h ago
Apartment for rent in San Pascual, Castilla y León, Street not specified
Apartment for rent in San Pascual, Castilla y León, Street not specified
Apartment for rent in San Pascual, Castilla y León, Street not specified
Apartment for rent in San Pascual, Castilla y León, Street not specified
More info
Ca. 115 m2 apartment for rent in Salamanca, Castilla y León, Street not specified
1 d ago
Ca. 115 m2 apartment for rent in Salamanca, Castilla y León, Street not specified
Ca. 115 m2 apartment for rent in Salamanca, Castilla y León, Street not specified
Ca. 115 m2 apartment for rent in Salamanca, Castilla y León, Street not specified
Ca. 115 m2 Rooms 4
Ca. 115 m2 apartment for rent in Salamanca, Castilla y León, Street not specified
More info
Ca. 65 m2 apartment for rent in Valladolid, Castilla y León, Calle Rúa Oscura
1 d ago
Ca. 65 m2 apartment for rent in Valladolid, Castilla y León, Calle Rúa Oscura
Ca. 65 m2 apartment for rent in Valladolid, Castilla y León, Calle Rúa Oscura
Ca. 65 m2 apartment for rent in Valladolid, Castilla y León, Calle Rúa Oscura
Ca. 65 m2
Ca. 65 m2 apartment for rent in Valladolid, Castilla y León, Calle Rúa Oscura
More info
Ca. 40 m2 apartment for rent in Aguilar de Campoo, Castilla y León, Street not specified
1 d ago
Ca. 40 m2 apartment for rent in Aguilar de Campoo, Castilla y León, Street not specified
Ca. 40 m2 apartment for rent in Aguilar de Campoo, Castilla y León, Street not specified
Ca. 40 m2 apartment for rent in Aguilar de Campoo, Castilla y León, Street not specified
Ca. 40 m2 Rooms 1
Ca. 40 m2 apartment for rent in Aguilar de Campoo, Castilla y León, Street not specified
More info
Ca. 65 m2 apartment for rent in Salamanca, Castilla y León, Street not specified
1 d ago
Ca. 65 m2 apartment for rent in Salamanca, Castilla y León, Street not specified
Ca. 65 m2 apartment for rent in Salamanca, Castilla y León, Street not specified
Ca. 65 m2 apartment for rent in Salamanca, Castilla y León, Street not specified
Ca. 65 m2 Rooms 3
Ca. 65 m2 apartment for rent in Salamanca, Castilla y León, Street not specified
More info
Ca. 15 m2 room for rent in Salamanca, Castilla y León, Calle Fernando Población
4 d ago
Ca. 15 m2 room for rent in Salamanca, Castilla y León, Calle Fernando Población
Ca. 15 m2 room for rent in Salamanca, Castilla y León, Calle Fernando Población
Ca. 15 m2 room for rent in Salamanca, Castilla y León, Calle Fernando Población
Ca. 15 m2
Ca. 15 m2 room for rent in Salamanca, Castilla y León, Calle Fernando Población
More info
Ca. 20 m2 apartment for rent in Salamanca, Castilla y León, Calle Fernando Población
5 d ago
Ca. 20 m2 apartment for rent in Salamanca, Castilla y León, Calle Fernando Población
Ca. 20 m2 apartment for rent in Salamanca, Castilla y León, Calle Fernando Población
Ca. 20 m2 apartment for rent in Salamanca, Castilla y León, Calle Fernando Población
Ca. 20 m2
Ca. 20 m2 apartment for rent in Salamanca, Castilla y León, Calle Fernando Población
More info
Ca. 170 m2 apartment for rent in Salamanca, Castilla y León, Street not specified
1 mo ago
Ca. 170 m2 apartment for rent in Salamanca, Castilla y León, Street not specified
Ca. 170 m2 apartment for rent in Salamanca, Castilla y León, Street not specified
Ca. 170 m2 apartment for rent in Salamanca, Castilla y León, Street not specified
Ca. 170 m2
Ca. 170 m2 apartment for rent in Salamanca, Castilla y León, Street not specified
More info